
A student sees a headline about a new gadget and asks how technology impacts society. Short answer: it changes energy, learning, relationships and information at the same time, so learners need to weigh benefits, costs and evidence together.
Use the routes below to decide where to start. Readers who want the long view can begin with The 7 Greatest Inventions Of All Time — How They Built The Modern World – Ricecatalyst, while those who prefer a forward look can open Future Technology Trends: 7 Breakthrough Innovations Shaping 2027 And Beyond – Ricecatalyst. Each route ends with questions you can reuse on any technology story.
Choose a route through the topic
Technology and society is too wide to read in a straight line. Pick the route that matches the question you actually have.
- Want the society-wide picture? Read the next section on benefits and trade-offs, then the comparison table that sets four technology areas side by side.
- Teaching or studying science with AI? Go to the section on AI in science education, then to the section on rules and ethics.
- Interested in climate, energy and resources? Follow the section on data centres and renewable energy.
- Worried about what is true online? Jump to the section on science misinformation.
- Curious about gadgets and machines? Go to the section on devices that sense, move and make.
If you are unsure, start with the misinformation route. Checking where a claim comes from is a skill that carries over to every other route, because each of them involves claims about what a technology can or cannot do.
Benefits and trade-offs across society
Technology affects society in several directions at once. The evidence is easiest to read when you separate what people report from what has been measured, because surveys capture public mood but cannot on their own prove that a device caused a change.
Wellbeing and relationships
A published roundup of Pew and Gallup findings reports that 48% of US teens said in 2025 that social media has a mostly negative effect on people their age, up from 32% in 2022. It also cites a Gallup 2024 finding that 20% of US adults experienced loneliness “a lot of the day yesterday”. Neither figure says that devices caused loneliness. Both describe how people characterise their own experience, and both are specific to the United States.
The same roundup notes that technology creates more chances for deception, particularly for vulnerable people. That is one reason the misinformation route later in this guide is useful to every reader and not only to teenagers.
Work and everyday tools
On the workplace side, the roundup cites a 2026 index in which 61% of US full-time employees said technology improves their workday, while 32% worried that AI erodes human connection. These two results fit together easily. A person can value a tool and still worry about what it displaces. For a learner, the useful habit is to keep benefit and cost in view together instead of choosing a side early.
Looking back to look forward
Historical context sharpens the picture. Black Inventors Who Changed The World: 3 Inventions That Shaped Modern Life – Ricecatalyst is a good place to ask who invented a technology, who received credit and who gained access, all of which are part of its social story. Those questions apply just as well to today’s AI tools, which is where the next section picks up.
AI in science education
AI is used in science education mainly as a tutor and a planning aid, and UNESCO treats it as a tool with real potential and real risks. The UNESCO overview of AI in education says AI has the potential to address some of the biggest challenges in education today, and it links that potential to Sustainable Development Goal 4 and the Education 2030 agenda.
What teachers say AI can offer
Teacher commentary on the UNESCO page describes classrooms being transformed with opportunities such as personalized tutoring and smarter lesson planning. In a science course, that could mean extra practice on a concept a student found hard, or help a teacher prepare varied material. The benefit is real only when the tool serves a learning goal that the teacher or student has already chosen.
The limits teachers name
The same commentary names the costs plainly: over-reliance, ethical concerns and declining deep reading skills. The last one matters most in science, where understanding often depends on reading a method or a result slowly and carefully. A sensible rule is to use AI to prompt thinking or to check understanding after reading, and not to replace the reading itself. A student who lets a summary stand in for the original text loses exactly the skill that spotting weak claims depends on.
Skills worth building first
UNESCO has also published AI competency frameworks, with separate versions for students and for teachers, to guide countries. Even without reading a full framework, learners can start with the mechanism. A plain-language explainer on how does machine learning work makes it easier to judge when an output deserves trust. Students who want habits of structured problem solving can then read what is computational thinking and see where coding fits.
Since many students meet AI through search boxes, how do search engines work is a useful companion, because it explains why two people can see different results. For the wider debate about devices in teaching, Smart Classrooms: Balancing The Pros And Cons Of Technology In The Classroom — A 2026 Guide – Ricecatalyst weighs what technology adds and what it can take away. The AI tools themselves also have a physical cost, which is the subject of the next route.
Data centres and renewable energy
Digital technology runs on physical infrastructure, and renewable energy is part of how societies respond to its demand for power. Figures reported by UNRIC on the energy use of AI draw on the International Energy Agency and other bodies, and they are best read with their years and definitions attached.
The footprint of digital technology
UNRIC reports that machine learning and AI accounted for less than 0.2% of global electricity demand in 2021 and less than 0.1% of global greenhouse gas emissions. Data centres, a broader category, accounted for about 1% of global electricity demand in 2022. Those are different measures from different years, so they should not be added together or treated as a trend. The number of data centres worldwide has risen from 500,000 in 2012 to 8 million in the 2025 article that reports it.
Resources beyond electricity matter too. Global AI demand is projected to consume 4.2–6.6 billion cubic metres of water by 2027, and UNRIC cites a figure of about 800 kg of raw materials needed to make a 2 kg computer. These are projections and estimates, and the useful reading is that digital technology has material inputs, not that any single figure settles the debate. To see where those data centres plug in, how does the internet work explains the cables, packets and data centres behind everyday online activity.
Renewable energy and AI planning
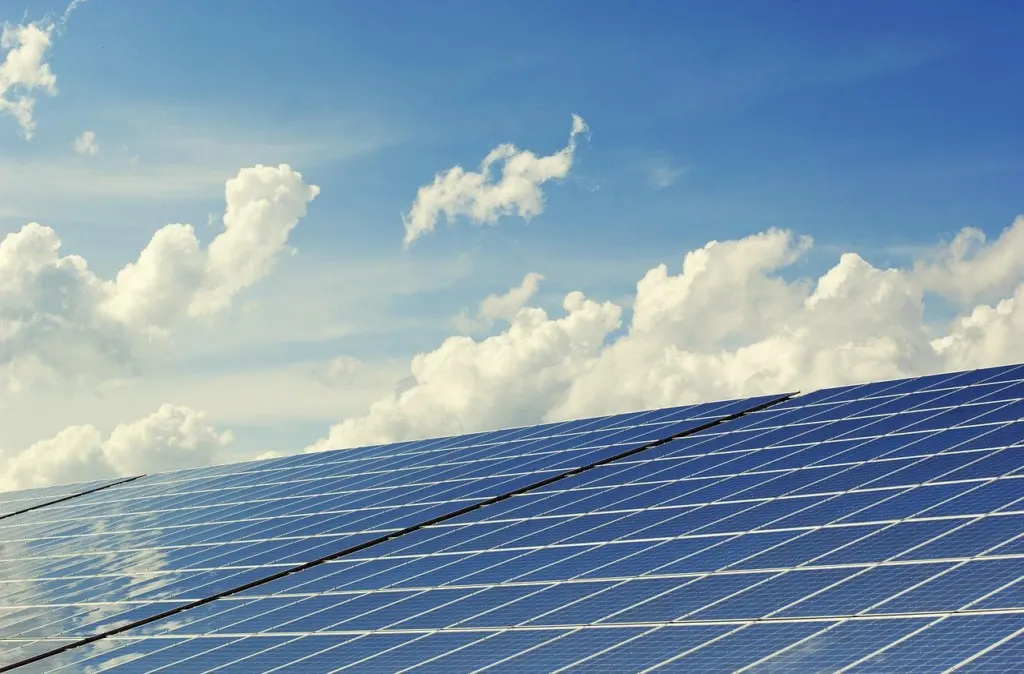
The same UNRIC report cites the UNEP Climate Technology Progress Report 2024 in saying AI is increasingly important in mapping renewable energy potential and optimizing efficiency. That is a planning role, and it sits on top of the machines that generate the power. Learners who want the generation side can start with how do solar panels work, which follows sunlight through to household power, and then how do wind turbines work, which also considers what turbines mean for communities.
Storage, transport and clean water
Renewable electricity raises further questions about storage, vehicles and resources. how does a hydrogen fuel cell work looks at one option and where it fits, while How Electric Cars Work: A Clear 2026 Guide To Batteries, Motors, Charging, And Range – Ricecatalyst covers the battery-and-motor route. Because water also features in the energy and AI story, how does desalination work offers a technology case study in turning a resource problem into an engineering one.
Environmental claims need data, so it helps to know where the numbers come from. how is air quality measured explains the measures and the citizen sensors that feed them, which is a good model for questioning any environmental statistic. Once you have these routes in mind, a side-by-side comparison helps show how the trade-offs differ by area.
Comparing trade-offs across four technology areas
The table puts AI in classrooms, AI’s physical footprint, AI in renewable energy planning and AI policy side by side on the same criteria. Choose the row that matches your situation: a teacher or student should start with the classroom row, while a reader following climate news should start with the footprint and renewable energy rows.
| Technology area | Benefit named | Cost or risk named | Planning use |
|---|---|---|---|
| AI in classrooms | Personalized tutoring and smarter lesson planning | Over-reliance, ethical concerns and declining deep reading skills | Ask whether the tool supports the learning goal or replaces the reading |
| AI’s physical footprint | Computing capacity for AI services | Electricity, projected water use and raw materials | Check the year and the measure before comparing figures |
| AI in renewable energy planning | Mapping renewable energy potential and optimizing efficiency | Needs strong governance frameworks for responsible use | Pair any AI claim with the physical equipment behind it |
| AI policy and ethics | Shared ethics recommendations and competency frameworks | Risks that have outpaced policy debates | Treat adoption as a starting point and look for classroom practice |
The table summarises material from UNESCO’s overview of AI in education and UNRIC’s report on AI energy use.
The pattern across the rows is that every benefit comes paired with a condition. That is a more useful lesson than any single entry, and it prepares you for the next route, where the condition is whether a claim can be trusted at all.
Spotting science misinformation
Students can spot science misinformation by tracing a claim to an original source they can open, and by treating AI chatbot answers as leads to verify rather than as facts. A library guide compiled by Olympic College on AI and misinformation gathers reporting and research that explain why.
Examples of how AI-era misinformation looks
The guide quotes a New York Times report from May 2025 on AI hallucinations: “Despite our best efforts, they will always hallucinate”, with the point being that hallucinations will never go away. A hallucination is an output that reads fluently but is not grounded in a real source. In science, that can look like a confident explanation of a finding or a reference that cannot be located.
The same guide lists a May 2025 benchmarking study of legal AI models, titled “AI on Trial: Legal Models Hallucinate in 1 out of 6 (or More) Benchmarking Queries”. It tested legal tools, not science tools, but it shows that even specialised systems produced invented material in a measurable share of queries. A reasonable inference for science learners is that a specialised label does not remove the need to check.
The guide also quotes Emily Bender of the University of Washington, who suggests that the best move may be to avoid relying on AI chatbots for factual information altogether. That is one expert’s strong position, and not every reader will adopt it. It is a good reason, though, to treat a chatbot as a place to generate questions and search terms and not as the final word on a result.
Images as evidence
Misinformation is not only text. A picture offered as proof of a scientific event or discovery can be generated, and a convincing image does not mean a real occurrence. For the visual side, how to tell if an image is ai generated explains how deepfakes and AI images are made and what clues to look for.
A step-by-step check for any science claim
- Find the original. Look for the study, dataset, agency page or university page that the claim says it relies on, and open it rather than trusting a summary of it.
- Open the citation. Confirm that the link works and that the page actually says what the claim says it says.
- Prefer primary and official sources. A government agency, university or international body that produced the data is stronger evidence than a post that repeats it.
- Look for a second independent source. If only one outlet carries a striking result, wait before sharing it.
- Check scope and date. A result about one group, place or year may not apply elsewhere or now.
- Use AI last. If a chatbot suggested the claim, verify it from the steps above before repeating it.
Verification habits work best when you understand the tools you are checking, which leads naturally to the devices that generate much of today’s scientific data.
Devices that sense, move and make
Many technologies that shape society are devices that collect data, act in the physical world or build objects, and each is a good case study in what a tool can and cannot do. Choose by the question you want answered rather than by novelty.
Sensing and connecting
For data collection, what is the internet of things explains how sensors and smart devices work together. How Does a GPS Tracker Work? A Clear, Practical Guide For 2026 – Ricecatalyst is a practical case of a sensor that raises everyday questions about location and privacy. how do drones work shows a tool scientists use to gather data from places that are hard to reach.
Acting and deciding
Machines that act raise questions of safety and trust. how do robots work follows the sensing, thinking and acting loop, and how do self driving cars work applies that loop to roads, with a focus on sensors, software and safety. If you read one of these, ask what the machine senses, what rules it follows and who is responsible when it errs.
Making and the frontier
For making things, How 3D Printing Works: A Clear, Visual Guide To Additive Manufacturing In 2026 – Ricecatalyst explains additive manufacturing visually, and it suits learners who want to turn an idea into a physical model. Readers curious about the research frontier can try how does a quantum computer work and what is nanotechnology, the latter covering scale, uses and safety.
Whichever device you pick, treat it as a way to practise the same questions: what is measured, who benefits and what happens when it fails. Those questions also help when looking at the sectors where technology is expected to change daily life.
Health, fashion and transport previews
Forward-looking articles are useful when you read them as sets of questions and not as promises. The Future Of Healthcare Technology: What’s Coming Next (2026–2035) – Ricecatalyst suits readers interested in how technology touches personal wellbeing. The Future Of Fashion Technology: How AI, Wearables, And Sustainable Tech Will Redefine Style By 2030 – Ricecatalyst is a good example of how AI, wearables and sustainability meet in an everyday industry. For transport, The Road Ahead: What Future Changes in Automobile Technology Will Mean For Drivers By 2035 – Ricecatalyst looks at what changes could mean for drivers.
When reading any of them, separate what is already in use from what is projected, and note who is making the projection. Predictions about technology depend on policy and public choices as much as on engineering, which is the subject of the next section.
Rules, ethics and who decides
Rules and ethics determine how technology’s benefits and costs are shared, and AI shows the difficulty clearly. UNESCO notes that rapid technological developments inevitably bring multiple risks and challenges, which have so far outpaced policy debates and regulatory frameworks, in its overview of AI in education.
There is also a sign of broad agreement. UNRIC reports that over 190 countries in the UN system have adopted the UNESCO Recommendations on the Ethics of Artificial Intelligence, as stated in its report on AI and energy. Adoption tells you who has endorsed shared principles. It does not on its own tell you how a particular school, company or app behaves day to day.
Because policy tends to lag, individual literacy fills part of the gap. That is why UNESCO’s separate competency frameworks for students and teachers matter: they treat understanding AI as something to be taught, not assumed. For learners, a practical response is to ask of any new tool who set its rules, who can check them and who is accountable when something goes wrong.
Reading evidence about technology
Learners can read technology evidence well by asking what was measured, for whom and when. These habits apply to the surveys, energy figures and policy claims met throughout this guide.
- Perception versus outcome. A survey of what people feel, such as the teen social media results, describes opinion. It is not the same as a measured change in behaviour or health.
- Place and population. Several figures here describe US adults, US teens or US employees. Do not stretch them to other countries without evidence.
- Year and definition. A share of electricity demand for AI in 2021 and a share for data centres in 2022 describe different things in different years. Keep them apart.
- Projection versus record. A water-use estimate for 2027 is a forecast. Treat it as a range of what might happen, not an outcome.
- Who is quoted. A teacher’s commentary, a researcher’s opinion and an agency’s data have different weight. Name which one you are relying on.
Used together, these questions turn a headline into a set of checkable claims. That is the practical answer to how technology impacts society for a science learner: the impact depends on the technology, the people and the evidence you can open and read yourself.
Frequently asked questions
| Question | Answer |
|---|---|
| Does a chatbot request use more electricity than a web search? | According to the IEA as reported by UNRIC, a single ChatGPT request requires about ten times more electricity than a Google search. That is a per-request comparison and not a statement about total demand. |
| Is screen time a good measure of how technology affects relationships? | No. Screen time shows how long someone was on a device but says nothing about relationship quality. A research roundup points to validated short scales, such as the three-item UCLA Loneliness Scale, as better tools. |
| Do AI search tools cite news sources reliably? | Not according to a Columbia Journalism Review study from March 2025 that compared eight AI search engines. Its title, “They’re All Bad at Citing News”, is listed in the Olympic College guide, so check any cited link yourself. |
| How much of a country’s electricity can data centres use? | It varies widely. UNRIC reports that data centres represented 17% of Ireland’s total electricity consumption in 2022, compared with about 1% of global electricity demand that year, in its report on AI and energy. |